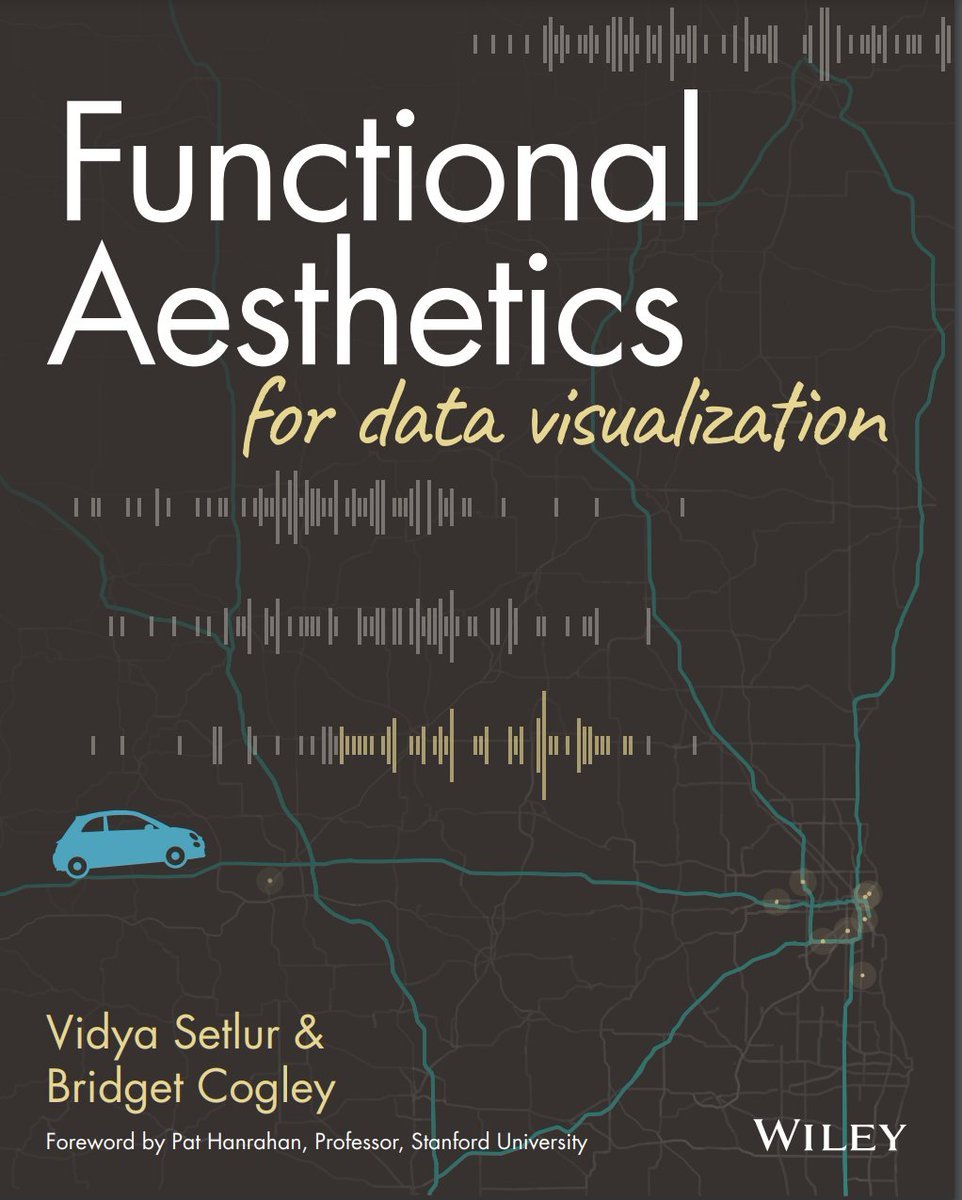
The Book
On sale NOW! Buy wherever books are sold!
Draw meaning with functional aesthetics.
Functional Aesthetics for Data Visualization is a visually engaging book that blends ideas from academia and practice for creating data-created interfaces, such as interactive dashboards and visualizations. We refer to this collection of principles as Functional Aesthetics based on cognitive psychology, design, information retrieval, and visualization to explore ways in which information can be presented to users for both meaning and delight.
Buy NOW wherever books are sold. Already got your copy? Tag us on social media with a picture and #FindTheFiat.
-
Blackwell's Books (UK)
-
Amazon
-
Barnes & Noble

This book explores the interplay between what we see (perception), what information is encoded (semantics), and what we mean (intent). Combined, this triad creates a powerful subsystem we call “functional aesthetics” as a way of using beauty and form to guide and support function.
It all started in a Fiat, headed to Milwaukee.
Vidya sat tucked in the backseat, suitcase nearby. Bridget sat in the front passenger seat while her husband drove. Prior to this trip, they had spoken only briefly.
They had finished delivering their presentations in Madison the day before and were preparing to repeat them again in Milwaukee. Vidya presented on color theory and semantics, while Bridget discussed the logic of dashboards. Together, these sessions represented two pieces of a puzzle - how semantics and visual aesthetics together help people see and understand their data.
Vidya, a research scientist at Tableau, spent years investigating iconography, semantics, and human-machine interaction. Bridget, Chief Visualization Officer at Versalytix, has a background in American Sign Language, interpreting and linguistics. The two of them learned data visualization on the job and leveraged their interdisciplinary background to understand it. They both saw how visualization relied on perception, semantics, and intent.
120 miles later, a friendship started, but so did this book.
Vidya Setlur
Researcher
Bridget Cogley
Practitioner


